Chapter 9 Single-Cell Data Integration
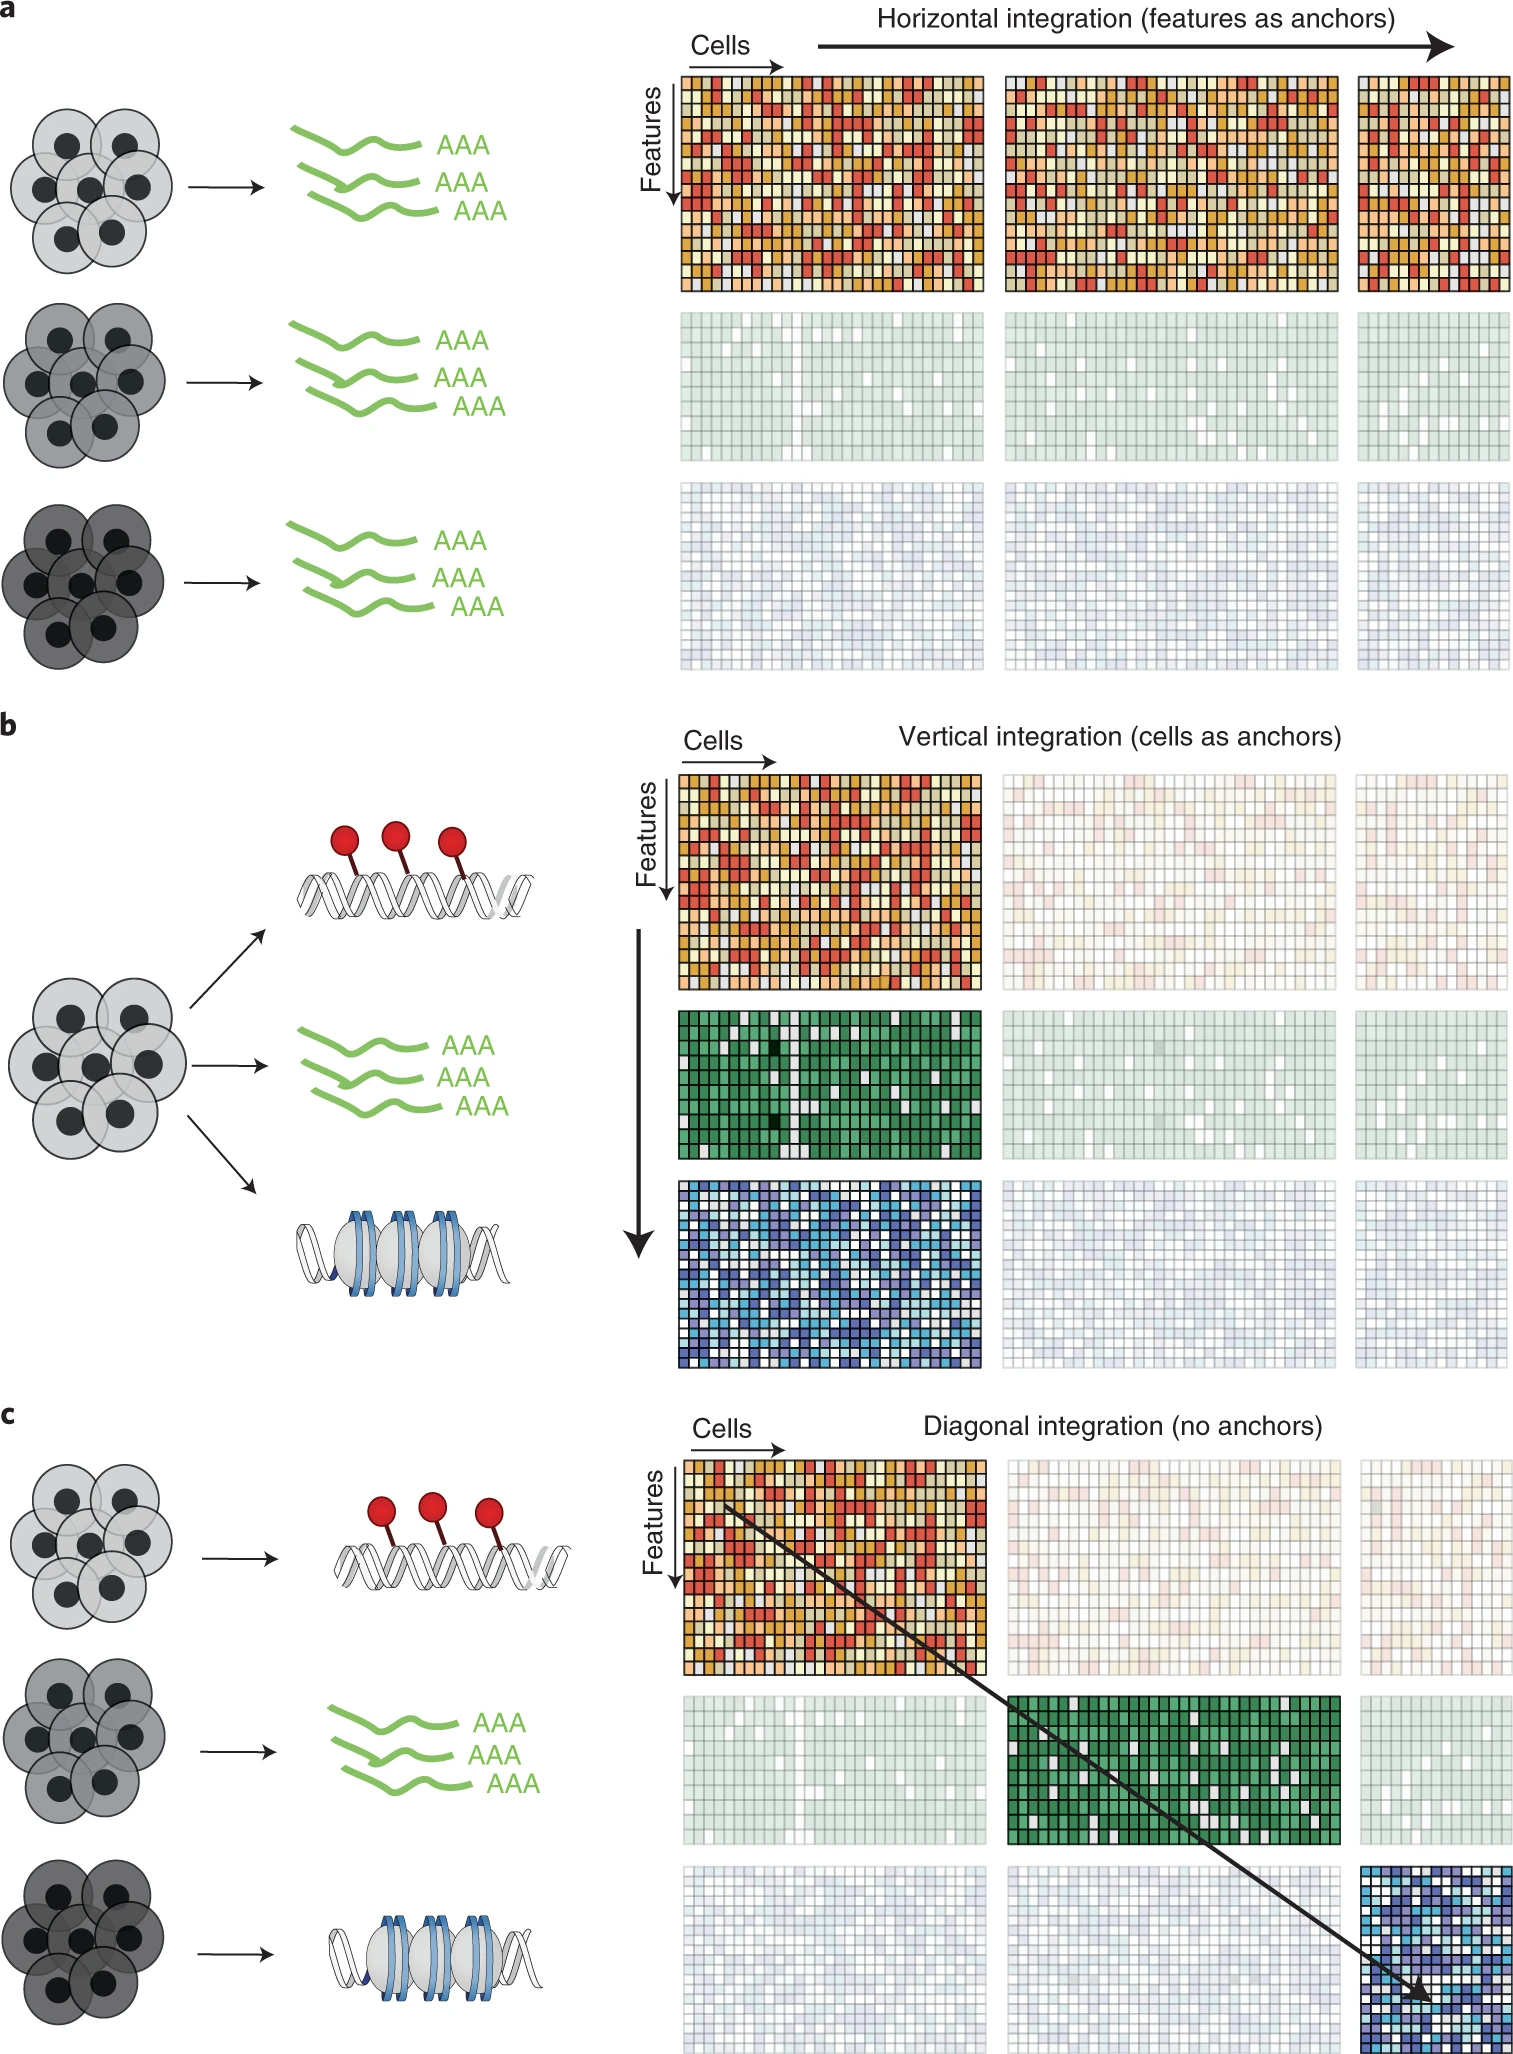
FIGURE 9.1: Challenges in multi-modal integration
Integrating single-cell multi-omics data (e.g., scRNA-seq, scATAC-seq) is essential for a holistic understanding of cellular states but comes with challenges:
- Different modalities have distinct statistical properties
- Confounding biological and technical sources of heterogeneity
- Missing values and sparsity across datasets
To tackle these, integration methods are categorized into horizontal (across cells or batches) and vertical (across modalities in the same cell) approaches.
9.1 Horizontal Integration
Used when cells are assayed with different modalities in different batches.
- Normalize expression and accessibility (e.g., gene activity as a surrogate for expression)
- Match shared features across modalities
Popular methods include:
- CCA (Canonical Correlation Analysis): Joint projection into a shared subspace
- Harmony: Corrects batch effects using soft clustering
- MNN (Mutual Nearest Neighbors): Aligns cell neighborhoods
- Scanorama, BBKNN, LIGER: Graph- or matrix-based manifold stitching approaches
![CCA-based integration of scRNA and scATAC [-@Stuart2019]](figures/CCA_scRNA_scATAC.png)
FIGURE 9.2: CCA-based integration of scRNA and scATAC (2019)
9.2 Vertical Integration
Used when different omics layers are measured from the same cell (e.g., 10x Multiome).
9.2.1 MOFA / MOFA+
- Probabilistic factor model with sparsity-aware priors
- Captures shared and modality-specific sources of variation
- Enables batch correction, dimensionality reduction, and imputation
![MOFA+ framework for joint dimensionality reduction [-@Argelaguet2020]](figures/MOFAplus.png)
FIGURE 9.3: MOFA+ framework for joint dimensionality reduction (2020)
9.2.2 LIGER (Linked Inference of Genomic Experimental Relationships)
- Non-negative matrix factorization
- Joint clustering via shared factor neighborhood graphs
- Learns both dataset-specific and shared gene modules
![LIGER joint clustering [-@Welch2019]](figures/LIGER.png)
FIGURE 9.4: LIGER joint clustering (2019)
9.3 Weighted Nearest Neighbors (WNN)
WNN builds modality-specific KNN graphs and learns weights for each modality per cell, generating a unified WNN graph for clustering and downstream analysis.
- Combines transcriptome and epigenome information
- Scales well and supports imputation when one modality is missing
![WNN: Combining cell-cell similarities across modalities [-@Hao2021]](figures/WNN.png)
FIGURE 9.5: WNN: Combining cell-cell similarities across modalities (2021)
9.4 Bridge Integration
Uses multi-omics data as a “dictionary” to integrate separately measured scRNA and scATAC datasets via shared latent spaces.
- Dictionary learning maps cells to atoms in multiome reference
- Use PCA, LSI, or CCA for initial embeddings
- Mutual nearest neighbors refine integration
![Bridge integration framework [-@Hao2022]](figures/BridgeIntegration.png)
FIGURE 9.6: Bridge integration framework (2022)
9.5 Deep Learning Approaches: MultiVI
MultiVI is a variational autoencoder for learning a joint latent space of scRNA and scATAC:
- Models transcriptome (NB) and accessibility (Bernoulli)
- Trained on multiome or paired data
- Supports imputation, batch correction, and latent space learning
![MultiVI for integrative latent representation [-@Ashuach2021]](figures/MultiVI.png)
FIGURE 9.7: MultiVI for integrative latent representation (2021)